A scatter chart template is a graph of plotted points that shows the relationship between two sets of data. They are used to plot the data points on horizontal and vertical axis that shows how much one variable is affected by another. A scatter chart template is known by many names such as scatter plot, scatter diagram and scatter graph. These charts are similar to the line charts because they also use horizontal and vertical axes to plot data points. Generally the independent variable is fixed on X-axis and the dependent variable on Y-axis.
Details of Scatter Chart Template
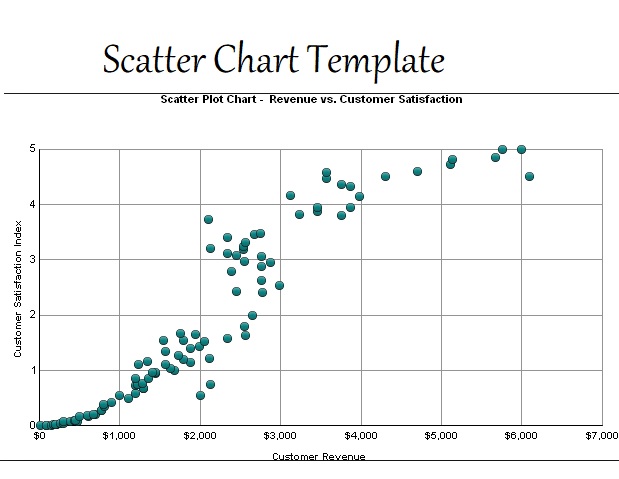
A scatter chart is the best way to compare two larger numbers of data without considering time. It is the most powerful of all charts as it is represents the relationship between two variables in an excellent way. Closer the plotted points, Stronger the relationship between two variables. If your chart is not showing any relationship between the variable, then you have to choose another chart to represent your data as it is not accurate for your data. It usually shows three types of correlations which usually consist of direction and strength of your data and these three are positive, negative and no correlation.
Benefits of Scatter Chart Template
A scatter chart, as the name suggested is a diagram which is used to find the correlation between these two variables. With the help of these graphs you can assess how closely the two variables are related. The behavior of the dependent variable based on the measure of the independent variable can be measured by knowing the correlation between these points. You can also find an unknown variable with the help of these graph and one known variable. There are various kinds of graphs which are used for your assistance. The basic purpose of all these graphs is to summarize the data and describe it in brief way.
Importance of Scatter Chart Template
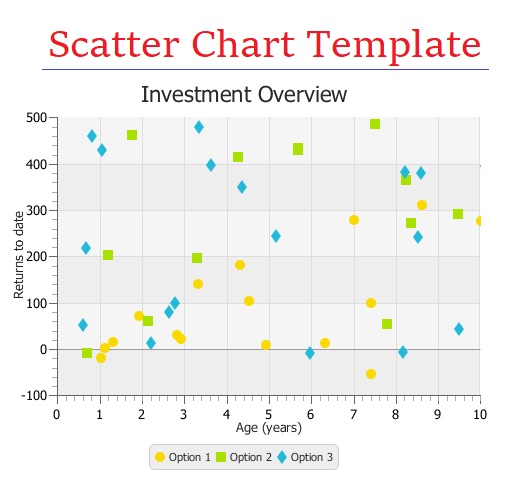
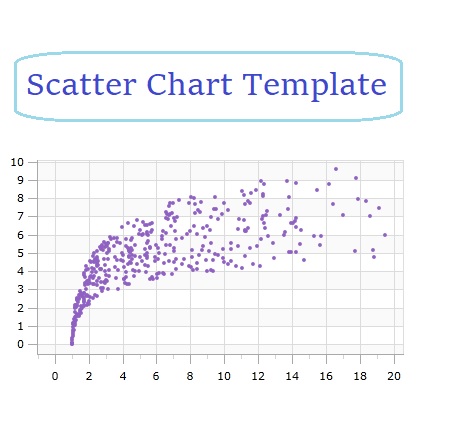
A scatter chart template used Cartesian coordinate system to display values for normally two variables for a group of data, and if the points are colored than one extra variable can be show. These charts are important for statistics because they can show the range of relationship between the variables, and it is called correlation. If the variables are connected the point will fall beside a line or curve. These scatter chart formats are used when you have paired the numeric data, when you’re trying to determine either the two variable are related and to determine intently whether a specific cause or affect are related. The graphs are very useful data visualization tools for depicting a trend.